The Complete Guide to the ROI of a Cookie Capper Machine
Author: Industrial Bakery Insights Team | Date: September 14, 2025
Executive Summary

For biscuit factory owners, financial decision-makers, and crucially, procurement managers, a critical financial question looms: how quickly does an investment in an automated
While manual labor may appear to have lower upfront costs, a detailed Total Cost of Ownership (TCO) and Return on Investment (ROI) analysis consistently reveals a vastly different financial reality.
According to a recent study in Industrial Machinery Review, automated biscuit sandwiching systems typically achieve payback periods of 6-18 months, with many high-volume operations seeing a full return in under a year. This rapid ROI is driven by significant labor savings, dramatic waste reduction, and enhanced production capacity.
This guide provides the framework and calculations you need to build a compelling business case for automation.
Understanding the Complete ROI & TCO Picture
A true financial analysis requires looking beyond the initial equipment price. For a procurement manager, this means understanding both direct cost savings and revenue-generating opportunities across the entire lifecycle.
This involves a Total Cost of Ownership (TCO) perspective. A complete
🧊 The Hidden Cost Iceberg of Manual Biscuit Sandwiching
As illustrated by the "Hidden Cost Iceberg" model, hourly wages are merely the visible tip. Recognizing the massive submerged portion of costs is key for strategic procurement. These hidden costs are often the source of major

Direct Labor Costs: Extends beyond base wages to include overtime, shift differentials, and the inherent inefficiencies of varying human speeds.
Benefits & Training: Includes employer contributions to health insurance, retirement, paid time off, and the continuous overhead of training and retraining.
Product Waste: Manual processes inherently lead to higher rejection rates (inconsistent cream, misalignment, breakage), representing lost raw materials and revenue.
Opportunity Cost: Manual speed limits your scalability, directly translating to missed opportunities for larger contracts or market expansion.
Compliance & Quality Risks: Manual operations increase the risk of inconsistent quality, making it harder to meet stringent food safety (e.g., HACCP, GFSI) and customer specifications.
Labor Turnover & Recruitment: High turnover in repetitive manual roles incurs continuous costs for recruiting, onboarding, and training new staff.
Ergonomic Injuries: Repetitive motion tasks are a known cause of worker fatigue and injuries, leading to workers' compensation claims and reduced morale.
📈 The Three Pillars of Automation ROI
Investing in automated equipment directly addresses these hidden costs, delivering tangible financial benefits.

1. Drastically Reduced Direct Labor Costs
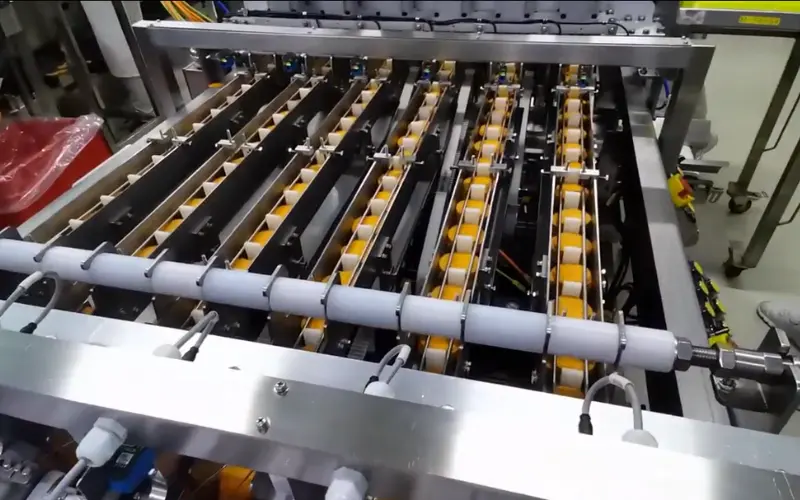
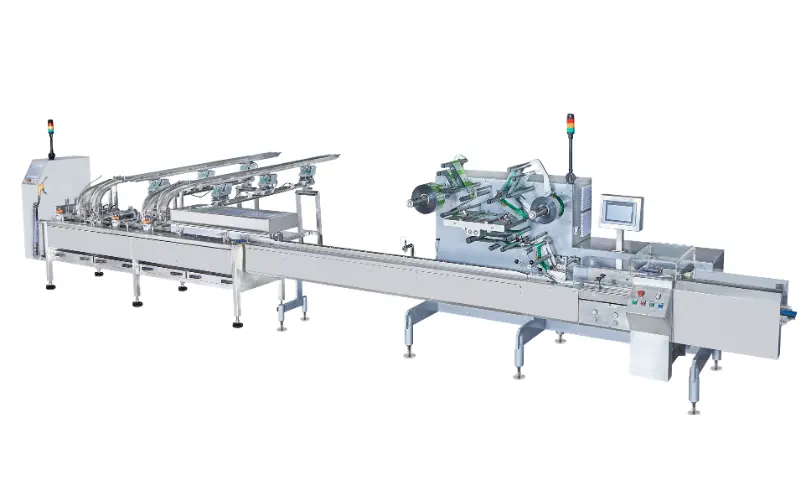
This is the most immediate and significant saving. A high-speed automated biscuit sandwiching line can replace the work of several employees per shift.
Calculation Example (Annual Labor Savings):
(5 Employees × $20/hour × 8 hours/shift × 2 shifts/day × 240 operating days) = $384,000 in annual wages
Factoring in 30% for benefits/overhead brings the total annual labor cost to $499,200.
2. Minimized Product Waste & Material Savings
Precision automation reduces rejection rates from typical manual levels (8-12%) to under 1%.
Calculation Example (Annual Waste Savings):
Manual Waste (10% rate): $20,000 in annual waste.
Automated Waste (1% rate): $2,000 in annual waste.
Total Annual Savings: $18,000
3. Increased Production Revenue (Realized Opportunity)
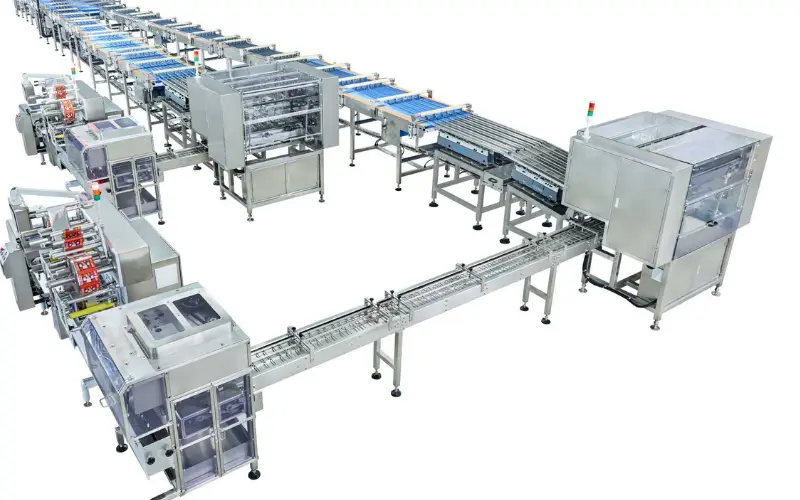
Automation doesn't just save costs; it generates additional revenue by increasing capacity and ensuring consistent quality. A high-speed line also requires a consistent flow from a reliable
This new capacity unlocks opportunities, from taking on private-label contracts to launching new product lines, similar to a
Calculation Example (Additional Annual Revenue):
(20% capacity increase × $600,000 annual revenue) = $120,000 in additional annual revenue.
💰 Real-World ROI Calculation: A Composite Case Study
This case study, based on a composite of several real-world client examples, provides a concrete benchmark. A key part of the process is learning to
The Challenge: A mid-sized bakery faced annual costs of $519,200 from manual sandwiching ($499,200 labor + $20,000 waste) and was limited in its growth.
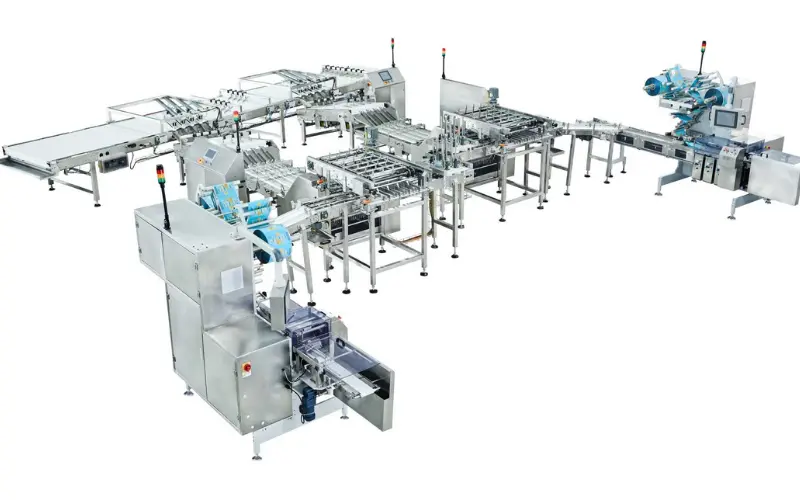
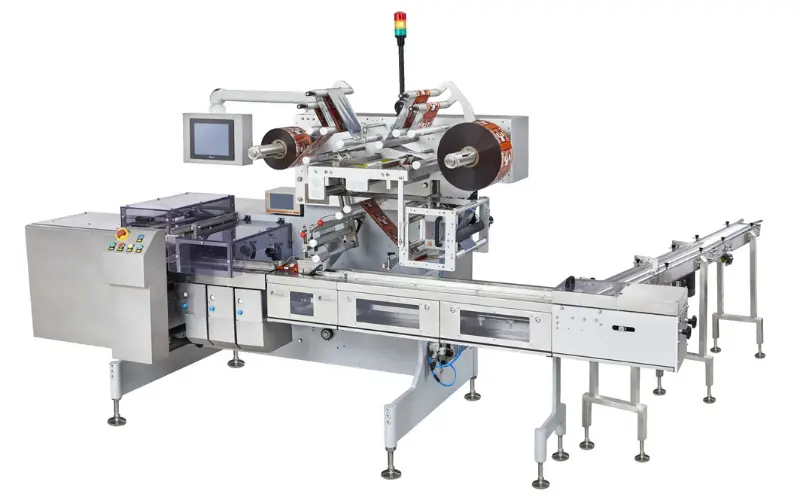
The Investment: The bakery invested approximately $170,000 in a high-speed, automated
cookie capper machine The Results (Annualized):
Labor Costs: Reduced from $499,200 to $25,000 (1 machine supervisor).
Product Waste: Reduced from $20,000 to $2,000.
Additional Revenue: Generated $120,000 from increased capacity.
Total Annual Savings & Revenue Gain: $587,200
Payback Period: 3.5 Months
ROI Calculation: ($587,200 Gain / $170,000 Investment) × 100 = 345.4% ROI
Payback Calculation: $170,000 Investment / $587,200 Gain = 0.29 years (or 3.5 months)
5-Year Financial Projection: Manual vs. Automated
For a long-term strategy, the 5-year Total Cost of Ownership (TCO) comparison is critical.
Data Source: Internal industry estimates based on the composite case study. Figures are illustrative.
The disparity is staggering. The TCO Comparison Chart (Image 3) visually reinforces this: a 5-year TCO for manual production at $3.19M versus just $330K for an automated process.
Data Source: Internal industry estimates based on the composite case study. Figures are illustrative.
The disparity is staggering. A 5-year TCO for manual production at $3.19M versus just $330K for an automated process.
How to Calculate Your Specific ROI: A Procurement Manager's Framework
Use this step-by-step framework to build a robust, custom ROI analysis for your finance team.
Calculate Your Annual Labor Cost(Employees × Hourly Rate × Hours/Shift × Shifts/Day × Operating Days) × 1.3 [for Benefits/Overhead]
Calculate Your Annual Waste Cost(Rejection Rate % × Annual Production Volume × Cost per Unit)
Estimate Additional Annual Revenue(Estimated Capacity Increase % × Current Annual Revenue)
Determine Total Annual Financial Impact(Annual Labor Savings + Annual Waste Savings + Additional Annual Revenue)
Calculate Your ROI %[(Total Annual Financial Impact - Annual Maintenance) / Initial Investment] × 100
Calculate Your Payback Period (in Years)Initial Investment / (Total Annual Financial Impact - Annual Maintenance)
Beyond the Numbers: Intangible ROI Factors
A procurement manager must also consider strategic, intangible factors that provide long-term value:
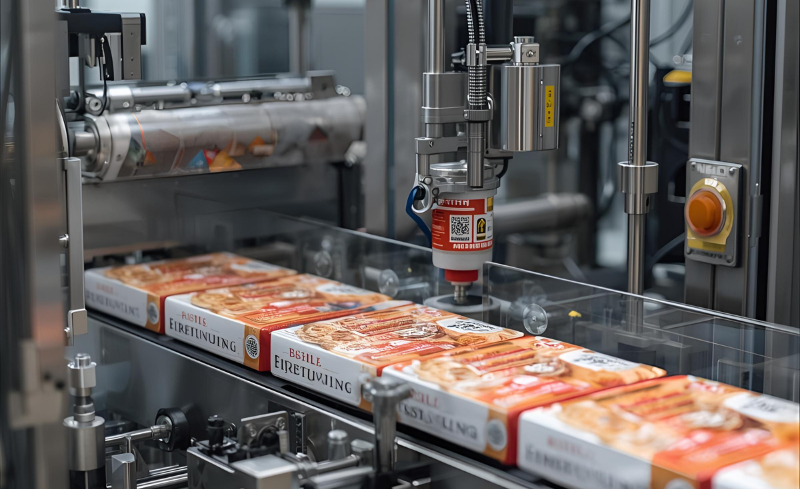
Quality & Brand Reputation: Automated precision ensures every single product meets exact brand standards.
Scalability: Automation removes human limitations. The same equipment can often scale capacity 50-150% with minimal additional labor.
Food Safety & Compliance: Reduced human contact minimizes contamination risk and simplifies compliance with rigorous standards.
Employee Satisfaction: Eliminates repetitive, ergonomically challenging tasks, allowing you to redeploy skilled staff to higher-value activities.
Reduced Risk Profile: Mitigates risks from labor shortages, strikes, and human error, providing crucial operational stability.
Frequently Asked Questions (FAQs) for Procurement Managers
What is a typical payback period for a cookie capper machine?Most operations achieve payback within 6-18 months. High-volume producers often see ROI in under 6 months, while smaller operations typically reach payback within 12-18 months.
How do maintenance costs affect overall ROI, and how predictable are they?Modern automated systems are engineered for durability and require minimal maintenance, typically costing 1-3% of the initial investment annually. This predictability allows for accurate long-term financial planning.
Can we phase our automation investment, starting with a single line?Yes, many clients strategically begin with a single automated line to validate the ROI and operational benefits before expanding. This phased approach minimizes initial risk.
How does automation impact our ability to secure large contracts?Automation significantly enhances your competitive positioning. The consistent quality, reliable delivery, scalable capacity, and documented efficiency are increasingly required by major retailers and large distributors.
Disclaimer: The financial projections provided are based on industry averages and typical client results. Your actual ROI may vary based on your specific operation, production volume, current labor costs, and local economic factors. We strongly recommend conducting a detailed analysis of your current costs.


Ready to start your journey toward a customized solution? Contact me directly on WhatsApp to begin the conversation.